Context #
This project establishes a robust, fully automated DevOps lifecycle for infrastructure observability. By integrating Terraform for Infrastructure as Code (IaC) with Docker Compose for orchestration, the solution delivers a scalable, high-performance monitoring stack centered on Prometheus and Grafana. This architecture ensures rapid deployment, consistency, and deep visibility into system health.
Client identity withheld under NDA. Architecture and outcomes described as delivered.
Constraints and objectives #
- Automate Infrastructure: Provision AWS resources seamlessly using Terraform to eliminate manual errors.
- Containerize Services: Deploy a comprehensive multi-container stack (Prometheus, AlertManager, Node Exporter, and Grafana) using Docker Compose.
- Enable Observability: Establish real-time monitoring and specific alerting rules to track system health and performance metrics.
- Streamline Operations: Implement end-to-end automation for setup and maintenance tasks using Shell scripting and Makefiles.
Architecture and implementation #
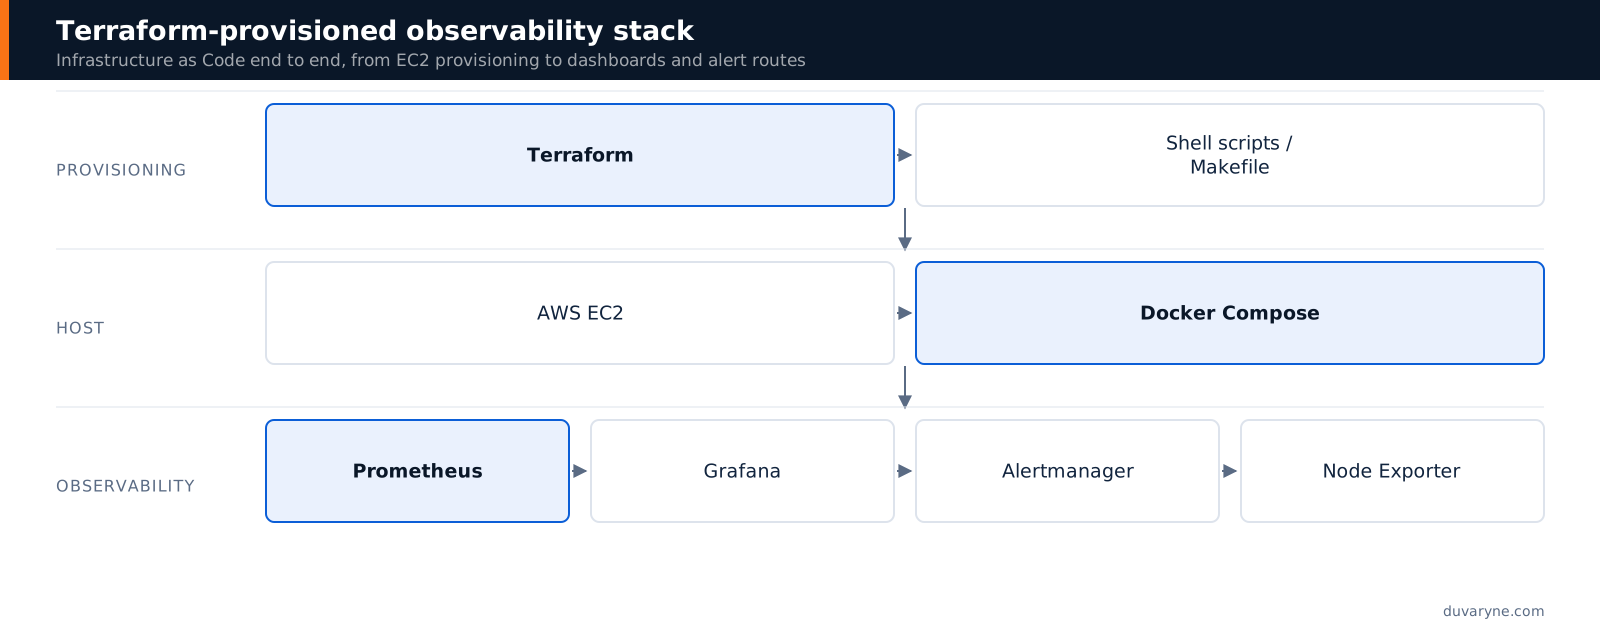
- Infrastructure as Code (IaC): Terraform
- Containerization & Orchestration: Docker, Docker Compose
- Observability Stack: Prometheus, Grafana, AlertManager, Node Exporter
- Automation: Shell Scripting (Bash), Makefiles
- Cloud Platform: AWS (EC2)
Outcomes #
- Zero-Touch Deployment: Achieved a significant reduction in manual configuration efforts through full automation pipelines.
- High Scalability: Created a modular, reproducible architecture that allows for easy replication across different environments.
- Proactive Monitoring: Enabled real-time performance tracking with instant alerts, allowing for faster incident response times.
- Enhanced Security: Enforced standardized, secure infrastructure provisioning via strict Terraform configurations.
What we would do differently #
Docker Compose on a single EC2 instance is the right answer for a monitoring stack that watches a handful of hosts, and the wrong one the moment the stack itself needs to be highly available. We would be clearer up front about where that line sits, because the natural next question — 'can we monitor production with this?' — has a different answer than the one the demo implies. Prometheus data also has no long-term home here; remote write to managed storage belongs in the first design, not the second.